

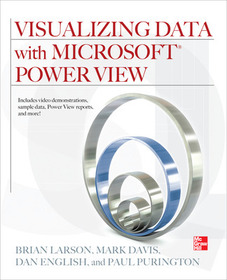
Visualizing Data with Microsoft Power View
Sorozatcím: DATABASE & ERP - OMG;
-
10% KEDVEZMÉNY?
- A kedvezmény csak az 'Értesítés a kedvenc témákról' hírlevelünk címzettjeinek rendeléseire érvényes.
- Kiadói listaár GBP 20.39
-
9 206 Ft (8 767 Ft + 5% áfa)
Az ár azért becsült, mert a rendelés pillanatában nem lehet pontosan tudni, hogy a beérkezéskor milyen lesz a forint árfolyama az adott termék eredeti devizájához képest. Ha a forint romlana, kissé többet, ha javulna, kissé kevesebbet kell majd fizetnie.
- Kedvezmény(ek) 10% (cc. 921 Ft off)
- Kedvezményes ár 8 285 Ft (7 890 Ft + 5% áfa)
Iratkozzon fel most és részesüljön kedvezőbb árainkból!
Feliratkozom
9 206 Ft

Beszerezhetőség
Bizonytalan ideig nincs raktáron a kiadónál, rendelése nem javasolt.
Why don't you give exact delivery time?
A beszerzés időigényét az eddigi tapasztalatokra alapozva adjuk meg. Azért becsült, mert a terméket külföldről hozzuk be, így a kiadó kiszolgálásának pillanatnyi gyorsaságától is függ. A megadottnál gyorsabb és lassabb szállítás is elképzelhető, de mindent megteszünk, hogy Ön a lehető leghamarabb jusson hozzá a termékhez.
A termék adatai:
- Kiadó McGraw Hill
- Megjelenés dátuma 2012. június 16.
- ISBN 9780071780827
- Kötéstípus Könyv
- Terjedelem0 oldal
- Méret 231x188x20 mm
- Súly 574 g
- Nyelv angol 0
Kategóriák
Rövid leírás:
This practical guide reveals how to unlock the power of Microsoft?s newest BI tool, Crescent, and build rich BI reports with just a few clicks.
TöbbHosszú leírás:
Publisher's Note: Products purchased from Third Party sellers are not guaranteed by the publisher for quality, authenticity, or access to any online entitlements included with the product.
Create and Distribute High-impact Microsoft Power View Reports
Explore data in insightful new ways and transform the way your enterprise uses BI with help from this expert guide. Visualizing Data with Microsoft Power View shows how to effectively analyze and communicate complex information through elegant interactive reports. Discover how to create and populate tables, connect to databases, build multi-view reports in real-time, and publish your results to end-users. BI Semantic Model development and administration are also covered in this comprehensive volume.
- Launch Power View and navigate its user interface
- Load BI from SQL databases and external sources
- Build basic and multi-level table visualizations
- Develop card-, chart-, and matrix-based reports
- Incorporate auto-sizing, filtering, tiling, and slicing
- Securely distribute reports via SharePoint and PowerPivot
- Add functionality with hierarchies, perspectives, and KPIs
- Design, deploy, and support custom BI Semantic Models
DVD includes:
- More than four hours of video demonstrations
- A complete package of sample data?a Power View-optimized BI Semantic Model, a SQL Server database, and additional underlying data sources
- Comprehensive instructions for creating a learning environment, including Windows Server, SharePoint Server 2010, and Microsoft SQL Server 2012 with PowerPivot and Reporting Services SharePoint integration
- Six completed Power View Reports that include multiple views, visualizations, and performance dashboards
- BI Semantic Model with advanced extensions using DAX functions, including date and time, mathematical, logical, informational, and statistical functions
Publisher's Note: Products purchased from Third Party sellers are not guaranteed by the publisher for quality, authenticity, or access to any online entitlements included with the product.
Create and Distribute High-impact Microsoft Power View Reports
Explore data in insightful new ways and transform the way your enterprise uses BI with help from this expert guide. Visualizing Data with Microsoft Power View shows how to effectively analyze and communicate complex information through elegant interactive reports. Discover how to create and populate tables, connect to databases, build multi-view reports in real-time, and publish your results to end-users. BI Semantic Model development and administration are also covered in this comprehensive volume.
- Launch Power View and navigate its user interface
- Load BI from SQL databases and external sources
- Build basic and multi-level table visualizations
- Develop card-, chart-, and matrix-based reports
- Incorporate auto-sizing, filtering, tiling, and slicing
- Securely distribute reports via SharePoint and PowerPivot
- Add functionality with hierarchies, perspectives, and KPIs
- Design, deploy, and support custom BI Semantic Models
DVD includes:
- More than four hours of video demonstrations
- A complete package of sample data?a Power View-optimized BI Semantic Model, a SQL Server database, and additional underlying data sources
- Comprehensive instructions for creating a learning environment, including Windows Server, SharePoint Server 2010, and Microsoft SQL Server 2012 with PowerPivot and Reporting Services SharePoint integration
- Six completed Power View Reports that include multiple views, visualizations, and performance dashboards
- BI Semantic Model with advanced extensions using DAX functions, including date and time, mathematical, logical, informational, and statistical functions
Tartalomjegyzék:
Part 1: Using Power View
1. Getting Started
2. The Table Visualization
3. Additional Visualizations
4. Charting
5. Bringing Your Data to Life
6. Sharing Reports
Part 2: Creating BI Semantic Models
7. BISM: Getting Started
8. Basic BI Semantic Model Design
9. BI Semantic Model: Additional Model Features
10. Using DAX Expressions
11. Deploying Tabular BI Semantic Models
Part 3: Appendixes
A. Installing and Configuring the Sample Data
B. Creating a Virtual Learning Environment

