

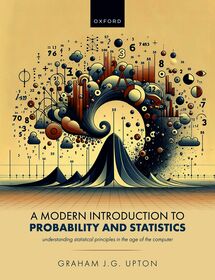
A Modern Introduction to Probability and Statistics
Understanding Statistical Principles in the Age of the Computer
-
10% KEDVEZMÉNY?
- A kedvezmény csak az 'Értesítés a kedvenc témákról' hírlevelünk címzettjeinek rendeléseire érvényes.
- Kiadói listaár GBP 40.00
-
18 060 Ft (17 200 Ft + 5% áfa)
Az ár azért becsült, mert a rendelés pillanatában nem lehet pontosan tudni, hogy a beérkezéskor milyen lesz a forint árfolyama az adott termék eredeti devizájához képest. Ha a forint romlana, kissé többet, ha javulna, kissé kevesebbet kell majd fizetnie.
- Kedvezmény(ek) 10% (kb. 1 806 Ft)
- Kedvezményes ár 16 254 Ft (15 480 Ft + 5% áfa)
Iratkozzon fel most és részesüljön kedvezőbb árainkból!
Feliratkozom
18 060 Ft

Beszerezhetőség
Becsült beszerzési idő: A Prosperónál jelenleg nincsen raktáron, de a kiadónál igen. Beszerzés kb. 3-5 hét..
A Prosperónál jelenleg nincsen raktáron.
Why don't you give exact delivery time?
A beszerzés időigényét az eddigi tapasztalatokra alapozva adjuk meg. Azért becsült, mert a terméket külföldről hozzuk be, így a kiadó kiszolgálásának pillanatnyi gyorsaságától is függ. A megadottnál gyorsabb és lassabb szállítás is elképzelhető, de mindent megteszünk, hogy Ön a lehető leghamarabb jusson hozzá a termékhez.
A termék adatai:
- Kiadó OUP Oxford
- Megjelenés dátuma 2025. július 1.
- ISBN 9780198943136
- Kötéstípus Puhakötés
- Terjedelem384 oldal
- Méret 245x190x17 mm
- Súly 793 g
- Nyelv angol
- Illusztrációk 82 600
Kategóriák
Rövid leírás:
Probability and statistics are subjects fundamental to data analysis, which, in turn, is essential for efficient artificial intelligence.
TöbbHosszú leírás:
Probability and statistics are subjects fundamental to data analysis, making them essential for efficient artificial intelligence. Although the foundational concepts of probability and statistics remain constant, what needs to be taught is constantly evolving.
The first half of the book introduces probability, conditional probability and the standard probability distributions in the traditional way. The second half considers the power of the modern computer and our reliance on technology to do the calculations for us.
Offering a fresh presentation that builds on the author's previous book, Understanding Statistics, this book includes exercises (with solutions at the rear of the book) and worked examples. Chapters close with a brief mention of the relevant R commands and summary of the content. Increasingly difficult mathematical sections are clearly indicated, and these can be omitted without affecting the understanding of the remaining material.
Aimed at first year graduates, this book is also suitable for readers familiar with mathematical notation.
Tartalomjegyzék:
1
Probability
Probability
1.1 Relative Frequency
1.2 Preliminary definitions
1.3 The probability scale
1.4 Probability with equally likely outcomes
1.5 The complementary event E'
1.6 Venn diagrams
1.7 Unions and intersections of events
1.8 Mutually exclusive events
1.9 Exhaustive events
1.10 Probability trees
1.11 Sample proportions and probability
1.12 Unequally likely possibilities
1.13 Physical independence
1.14 Orderings
1.15 Permutations and combinations
1.16 Sampling without replacement
1.17 Sampling without replacement
Conditional Probability
2.1 Notation
2.2 Statistical independence
2.3 Mutual and pairwise independence
2.4 The total probability theorem (The partition theorem)
2.5 Bayes’ theorem
2.6 *The Monty Hall problem
Probability distributions
3.1 Notation
3.2 Probability distributions
3.3 The discrete uniform distribution
3.4 The Bernoulli distribution
3.5 The Binomial Distribution
3.6 Notation
3.7 ‘Successes’ and ‘Failures’
3.8 The shape of the binomial distribution
3.9 The geometric distribution
3.10 The Poisson distribution and the Poisson process
3.11 The form of the distribution
3.12 Sums of Poisson random variables
3.13 The Poisson approximation to the binomial
3.14 The negative binomial distribution
3.15 The hypergeometric distribution
Expectations
4.1 Expectations of functions
4.2 The population variance
4.3 Sums of random variables
4.4 Mean and variance of common distributions
4.5 The expectation and variance of the sample mean
Continuous random variables
5.1 The probability density function (pdf)
5.2 The cumulative distribution function, F
5.3 Expectations for continuous variables
5.4 Obtaining f from F
5.5 The uniform (rectangular) distribution
5.6 The exponential distribution
5.7 *The beta distribution
5.8 *The gamma distribution
5.9 *Transformation of a random variable
The Normal Distribution
6.1 The general normal distribution
6.2 The use of tables
6.3 Linear combinations of independent normal random variables
6.4 The Central Limit Theorem
6.5 The normal distribution used as an approximation
6.6 *Proof that the area under the normal curve is 1
Distributions related to the normal distribution
7.1 The t distribution
7.2 The chi-squared distribution
7.3 The F distribution
*Generating functions
8.1 The probability generating function, G
8.2 The moment generating function
*Inequalities and laws
9.1 Markov’s inequality
9.2 Chebyshev’s inequality
9.3 The weak law of large numbers
9.4 The strong law of large numbers
Joint Distributions
10.1 Joint probability mass function
10.2 Marginal distributions
10.3 Conditional distributions
10.4
2
Statistics
Data sources
11.1 Data collection by observation
11.2 National Consuses
11.3 Sampling
11.4 Questionnaires
11.5 Questionnaire Design
Summarising data
12.1 A single variable
12.2 Two variables
12.3 More than two variables
12.4 Choosing which display to use
12.5 Dirty Data
General Summary Statistics
13.1 Measure of location: The mode
13.2 Measure of location: The mean
13.3 Measure of location: The mean of a frequency distribution
13.4 Measure of location: The mean of grouped data
13.5 Simplifying calculations
13.6 Measure of location: The median
13.7 Quantiles
13.8 Measures of spread: The Range and Inter-quartile Range
13.9 Boxplot
13.10 Deviations from the mean
13.11 The mean deviation
13.12 Measure of spread: The variance
13.13 Calculating the variance by hand
13.14 Measure of spread: The standard deviation
13.15 Variance and standard deviation for frequency distributions
13.16 Symmetric and skewed data
13.17 Standardising to a prescribed mean and standard deviation
13.8 *Calculating the combined mean and variance of several samples
13.19 Combining proportions
Point and interval estimation
14.1 Point estimates
14.2 Estimation methods
14.3 Confidence intervals
14.4 Confidence intervals with discrete distributions
14.5 One-sided confidence intervals
14.6 Confidence intervals for a variance
Single-sampled hypothesis tests
15.1 The null and alternative hypothesis
15.2 Critical regions and significance levels
15.3 The test procedure
15.4 Identifying two hypotheses
15.5 Tail probabilities: the p value approach
15.6 Hypothesis tests and confidence intervals
15.7 Hypothesis tests for a mean
15.8 Testing for normality
15.9 Hypothesis test for the variance of a normal distribution
5.10 Hypothesis tests with discrete distributions
5.11 Type I and Type II errors
5.12 Hypothesis tests for a proportion based on a small sample
15.13 Hypothesis tests for a Poisson mean based on a small sample
Two samples & paired samples
16.1 The comparison of two means
16.2 Confidence interval for the difference between two normal means
16.3 Paired samples
16.4 The comparison of the variances of two normal distributions
16.5 Confidence interval for a variance ratio
Goodness of fit
17.1 The chi-squared test
17.2 Small expected frequencies
17.3 Goodness of fit to prescribed distribution type
17.4 Comparing distribution functions
17.5 The dispersion test
17.6 Contingency tables
17.7 The 2 x 2 table: the comparison of two proportions
17.8 *Multi-way contingency tables
Correlation
18.1 The product-moment correlation coefficent
18.2 Nonsense correlation: storks and goosebury bushes
18.3 The ecological fallacy: Immigration and illiteracy
18.4 Simpson's paradox: Amputation or injection?
18.5 Rank correlation
Regression
19.1 The equation of a straight line
19.2 Why 'regression'?
19.3 The method of least squares
19.4 Transformations, extrapolation and outliers
19.5 Properties of the estimators
19.6 Analysis of Variance (ANOVA)
19.7 Multiple Regression
20 *The Bayesian approach

