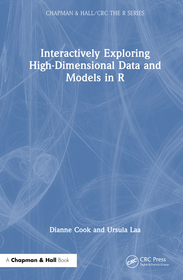
Interactively Exploring High-Dimensional Data and Models in R
Series: Chapman & Hall/CRC The R Series;
- Publisher's listprice GBP 120.00
-
57 330 Ft (54 600 Ft + 5% VAT)
The price is estimated because at the time of ordering we do not know what conversion rates will apply to HUF / product currency when the book arrives. In case HUF is weaker, the price increases slightly, in case HUF is stronger, the price goes lower slightly.
- Discount 10% (cc. 5 733 Ft off)
- Discounted price 51 597 Ft (49 140 Ft + 5% VAT)
Subcribe now and take benefit of a favourable price.
Subscribe
57 330 Ft

Availability
Not yet published.
Why don't you give exact delivery time?
Delivery time is estimated on our previous experiences. We give estimations only, because we order from outside Hungary, and the delivery time mainly depends on how quickly the publisher supplies the book. Faster or slower deliveries both happen, but we do our best to supply as quickly as possible.
Product details:
- Edition number 1
- Publisher Chapman and Hall
- Date of Publication 5 December 2025
- ISBN 9781032748443
- Binding Hardback
- No. of pages272 pages
- Size 234x156 mm
- Language English
- Illustrations 29 Illustrations, black & white; 142 Illustrations, color; 70 Halftones, color; 29 Line drawings, black & white; 72 Line drawings, color; 11 Tables, black & white 700
Categories
Short description:
High-dimensional data visualisation is valuable for understanding dimension reduction methods, unsupervised and supervised classification. This book is organised into these three topics, following overview and introductory chapters and could form an independent course on visualization.
MoreLong description:
Most data arrive with more than two numeric variables which means that plotting it on a computer screen or printed page presents a challenge: how do you visually explore for associations between more than two variables? Visualising data provides the opportunity to discover what we never expected, because it requires fewer assumptions to be made. Visualising elements of a model fit is a primary way to diagnose whether the fit matches this data. Two of more numeric variables is considered to be multivariate data, and when there are substantially more we would consider it to be high-dimensional data. This book provides you with the tools to visually explore high dimensions, to uncover associations, clustering and anomalies that may be missed when only using common methods for plotting one or two variables. It also illustrates how to use visualisation to understand how your model is operating on the data, to be able to explain how it is arriving at decisions. To make effective use of this material the reader should have a basic working knowledge of R and some understanding of multivariate statistical methods or machine learning methods. The book could form an independent course on visualization or be used as part of courses on multivariate statistical methods or machine learning.
High-dimensional data visualisation is valuable for understanding dimension reduction methods, unsupervised and supervised classification. This book is organised into these three topics, following overview and introductory chapters. The dimension reduction chapters cover principal component analysis and nonlinear dimension reduction. The chapters on cluster analysis cover hierarchical and k-means algorithms, model-based and self-organising maps, and finish with ways to communicate results and how to compare different results. The chapters on classification cover linear discriminant analysis, tree and forest algorithms, support vector machines and neural networks. We explain how to break down a neural network to examine the components, how to visualize predictive probabilities, and how to incorporate explainable AI metrics to develop a deeper understanding about how the model operates.
More
Table of Contents:
Preface I Introduction 1 Picturing high dimensions 2 Technical details II Dimension reduction 3 Dimension reduction overview 4 Principal component analysis 5 Non-linear dimension reduction III Cluster analysis 6 Introduction to clustering 7 Spin-and-brush approach 8 Hierarchical clustering 9 k-means clustering 10 Model-based clustering 11 Self-organizing maps 12 Summarising and comparing clustering results IV Supervised classification 13 Introduction to supervised classification 14 Linear discriminant analysis 15 Trees and forests 16 Support vector machines 17 Neural networks and deep learning 18 Diagnostics for classification models References Appendices A Toolbox B Data C Links to Book Code and Additional Data D Glossary Index
More


