

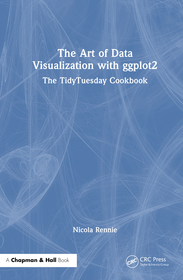
The Art of Data Visualization with ggplot2
The TidyTuesday Cookbook
-
GET 10% OFF
- Publisher's listprice GBP 145.99
-
65 914 Ft (62 775 Ft + 5% VAT)
The price is estimated because at the time of ordering we do not know what conversion rates will apply to HUF / product currency when the book arrives. In case HUF is weaker, the price increases slightly, in case HUF is stronger, the price goes lower slightly.
- Discount 10% (cc. 6 592 Ft off)
- Discounted price 59 322 Ft (56 498 Ft + 5% VAT)
59 322 Ft

Availability
Not yet published.
Why don't you give exact delivery time?
Delivery time is estimated on our previous experiences. We give estimations only, because we order from outside Hungary, and the delivery time mainly depends on how quickly the publisher supplies the book. Faster or slower deliveries both happen, but we do our best to supply as quickly as possible.
Product details:
- Edition number 1
- Publisher Chapman and Hall
- Date of Publication 9 November 2026
- ISBN 9781032766249
- Binding Hardback
- No. of pages392 pages
- Size 234x156 mm
- Language English
- Illustrations 61 Illustrations, black & white; 71 Illustrations, color; 20 Halftones, black & white; 5 Halftones, color; 41 Line drawings, black & white; 66 Line drawings, color; 1 Tables, black & white 700
Categories
Short description:
The visualizations in this book are not necessarily always the most effective choice of visualization for the data and relationship shown. Rather, this book aims to show you examples of the end-to-end process of creating data visualizations, with a focus on the technical details of building them in R.
MoreLong description:
Data visualization can be a very effective and efficient means of communicating information. Visualizing data typically serves one of two purposes: (i) as part of exploratory analysis to help uncover discrepancies in data and identify interesting relationships to measure; or (ii) to communicate key insights and messages to a broader audience. The case-study nature of this book means it covers both aspects, though it focuses mostly on the second. Choosing an appropriate type of visualization and making careful choices about design can clarify the message it is meant to convey to a reader.
The visualizations in this book are not necessarily always the most effective choice of visualization for the data and relationship shown. Rather, this book aims to show you examples of the end-to-end process of creating data visualizations, with a focus on the technical details of building them in R.
This book is primarily aimed at those who wish to develop their data visualization skills in R. Readers of this book may find a basic knowledge of R, more specifically of the?tidyverse?ecosystem, useful - although all code used in examples is fully explained. Readers do not need to be experienced in?ggplot2, though this book will also be of interest to those who are. This book will also be of interest to those who are already familiar with R (including?ggplot2), and wish to develop their skills in designing data visualizations further. It will also interest those who already design data visualizations using other tools, and want to learn how to do the equivalent in R.
MoreTable of Contents:
Preface Acknowledgements Author 1 Introduction?I Common charts don?t need to be boring! 2 Programming languages: dumbbell charts with ggplot2?3 UK museums: highlighting line charts with gghighlight?4 Bee colony losses: visualizing quantities with Poisson disk sampling?5 Animal shelter intakes: making gauge charts with ggforce?II Making use of icons fonts and text 6 Canadian wind turbines: waffle plots and pictograms?7 Cats: data-driven annotations with ggtext?8 Nobel Prize laureates: positioning text and parameterizing plots III Working with images 9 Lemurs: manipulating images in R?10 R packages: using images for custom facet labels?IV Visualizing spatial data 11 Doctors across the world: making maps with ggplot2?12 Time zones: spatial data and mapping with sf?13 US House elections: geography on a grid with geofacet?14 Other tips and tricks?Bibliography Appendix?Index
More
